Crude oil: Iranian flows spook the market
Falling Iranian exports have been the key driver for crude oil prices, whilst the lack of action from OPEC to counter falling Iranian supply has only added to the bullish sentiment. As a result of this, we expect prices to remain well supported for the rest of the year and have raised our 4Q18 Brent forecast. Demand risks will likely play out more over 2019
Where next for prices?
Oil prices are likely to remain well supported for the remainder of this year, the market is set to be in deficit over 4Q18, while Iranian exports have fallen more than expected. There is also the uncertainty over whether OPEC has the capability to make up for any shortfalls in the short term. We struggle to identify a catalyst that would put significant downward pressure on the market in the short term, and as a result, we have revised higher our 4Q18 Brent forecast from $75 per barrel to $85 per barrel. However, we still foresee weaker prices moving into 2019, with downside risks to oil demand growth, driven by the ongoing trade war, and the current strength in oil prices coupled with emerging market currency weakness.
Iranian flows falling quicker than expected
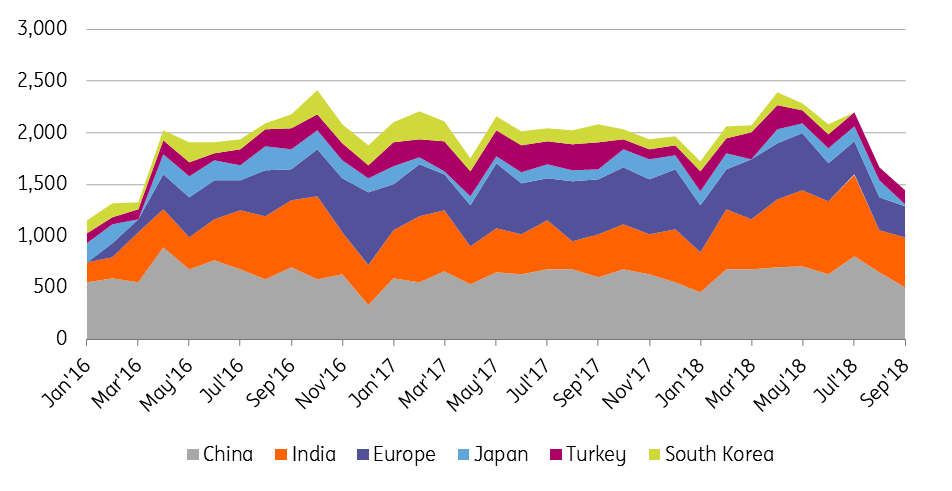
Tightness has stemmed from falling Iranian flows, with the latest ship tracking data continuing to show exports trending lower. Data from Bloomberg shows that shipments in September fell to 1.6MMbbls/d, down from 1.83MMbbls/d in the previous month, and almost 900Mbbls/d lower than the highs seen in April. These large declines have occurred even before sanctions come into force on 4 November, so this does suggest that there is further downside post November.
While it is widely accepted that the EU will likely fall away altogether as a buyer of Iranian crude oil, there is still plenty of uncertainty around China and India. India is the second largest buyer of Iranian crude oil, importing around 580Mbbls/d so far in 2018, which is equivalent to around 28% of total Iranian crude oil exports. India will be keen to secure waivers which would allow them to continue purchasing discounted Iranian oil, although likely at reduced volumes.
Meanwhile China, the largest buyer of Iranian crude oil has also seen reduced imports over the past couple of months- flows fell from a record 806Mbbls/d in July, to just 500Mbbls/d in September- the lowest level since January. There have also been media reports that Chinese buyer Sinopec will halve loadings this month, as a result of pressure from the US. However, we continue to hold the view that China will at least try to maintain purchases, with discounted Iranian crude oil just too tempting.
However, the ability to track Iranian shipments accurately is a growing issue, and this will only increase as we move closer towards the official start of sanctions. There have been reports of tankers switching off transponders, making it more difficult to track, and therefore actual flows are likely higher than what AIS vessel tracking shows.
Iranian crude oil exports fall as sanctions approach (Mbbls/d)

Will OPEC+ make up for Iranian shortfalls?
While falling Iranian exports have been a bullish factor for the market, this has been exacerbated by the perception that OPEC+ have not done enough to compensate for Iranian losses. Expectations heading into the recent OPEC meeting in Algiers were high, with President Trump calling on OPEC- through a tweet- to lower prices, whilst there were also media reports that the group would look to increase output by an additional 500Mbbls/d. OPEC ignored Trump and decided against any production increases.
This has called into question the capability of OPEC to make up for supply shortfalls, not just from Iran, but also for the continual declines that we are seeing from Venezuela. OPEC production is estimated to have averaged 32.57MMbbls/d in August, up from 32.13MMbbls/d in May and 32.28MMbbls/d in June. Back at the OPEC+ meeting in June, the group decided to increase production by 1MMbbls/d, which would bring compliance for the group back to 100%. However, so far they have failed to achieve this, with the Joint Ministerial Monitoring Committee actually reporting that over compliance in August increased from 109% to 129%. While part of this might come down to whether OPEC has the ability to respond quickly to falling output of certain members, there may also be a reluctance to do so, particularly following the pressure seen on the market over the summer, when certain OPEC+ members started to respond with higher output.
What will cap the oil rally?
At the moment it is difficult to identify a near-term catalyst for weaker prices. Speculative positioning in ICE Brent has increased significantly over recent weeks, with the net long position growing from 324,431 lots at the end of August to 496,343 lots in the last reporting period. However looking at historical positioning, they could still have some way to go, having held a record net long of 632,454 lots back in April. If we look at the net long in US dollar value, again it suggests that speculators do have some room to increase their positioning further- currently the spec net long is worth $42 billion, compared to $46.3 billion back in April.
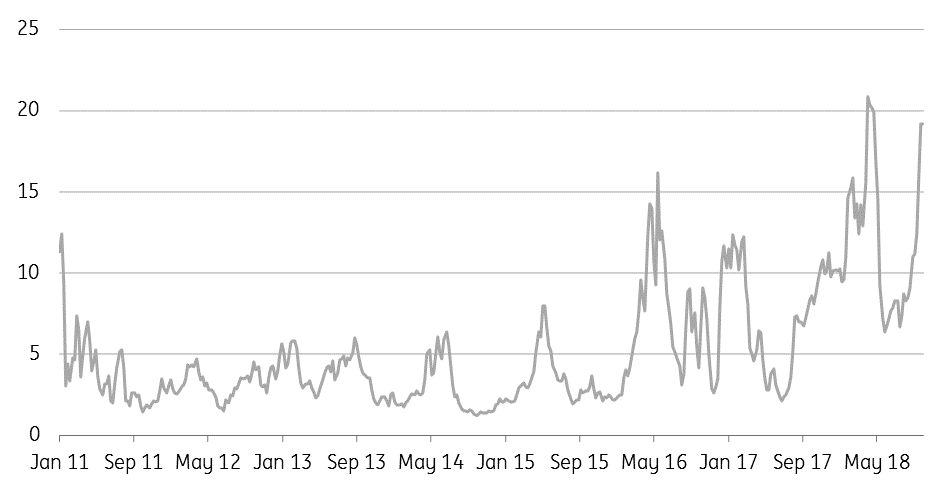
However, the one measure which does suggest that speculative longs may be overextended is the long/short ratio. As of the last reporting period, there were 19.2 longs for every short position, this compares to 20.8 back in April. In reality, the current ratio is likely to be even higher, given that since last Tuesday the market has rallied more than 4%.
But in order to see speculators reduce their positioning, there needs to be a catalyst. The most likely would have been a release from the US Strategic Petroleum Reserve (SPR), however recently the US Energy Secretary, Rick Perry, ruled out such action. Still, with prices having rallied even further since he made that comment, the US may have no choice but to tap into its SPR, if it wants to attempt to rein in prices. Taking such action would likely mean relatively more pressure for WTI, and so further pressure for the WTI/Brent spread.
In the longer run, concerns over demand growth and continued non-OPEC supply growth are factors we believe will weigh on the market over 2019.
ICE Brent speculative long/short ratio approaching recent highs once again

Demand growth risks
The clear downside risk for the market remains demand growth. Trade tensions, along with concerns over emerging markets are a real risk for the market. Emerging markets make up almost 90% of the total 1.4MMbbls/d expected demand growth in 2019.
Concerns about trade are largely centred on China. The government has announced/brought forward a number of stimulus programmes with the hope of maintaining growth rates, and offsetting the impact from US tariffs on Chinese goods. It is yet to be seen how effective this will be, however China’s official manufacturing PMI for September came in below market expectations, and in fact was the lowest monthly number seen since February. Meanwhile, industrial profit growth for manufacturers in August slowed to 9.2% year-on-year, compared to 16.2% in July. These weaker numbers suggest we are already seeing an impact from tariffs. As a result of concerns over the trade war, our Chinese economist has revised lower GDP growth expectations for both 2018 and 2019. For 2018, we now expect GDP growth of 6.6% (vs. 6.7% previously), and 6.3% in 2019 (vs. 6.5% previously).
Turning to other emerging markets, the real risk comes down to the current strength in oil prices and depreciating currencies, which is having an impact on a number of key importers' current account balances. We have also seen over the last year a number of governments introduce or increase fuel subsidies, and while this does help limit the potential impact on demand, there are also likely limits to how much governments are willing to subsidise, as a number of them are grappling with widening fiscal deficits.
US still growing...just not as quickly as initially expected
There is no denying that US production growth has been quite amazing. Looking at monthly production data from the Energy Information Administration, output over July averaged 10.96MMbbls/d- an increase of 1.7MMbbls/d YoY. Production is expected to average 10.66MMbbls/d over 2018, and 11.5MMbbls/d over 2019. However it has not been plain sailing for the industry, with the rig count largely stagnant since the start of the summer, whilst weekly production estimates from the EIA have fallen short of actual production numbers highlighted by monthly data for several months so far this year.
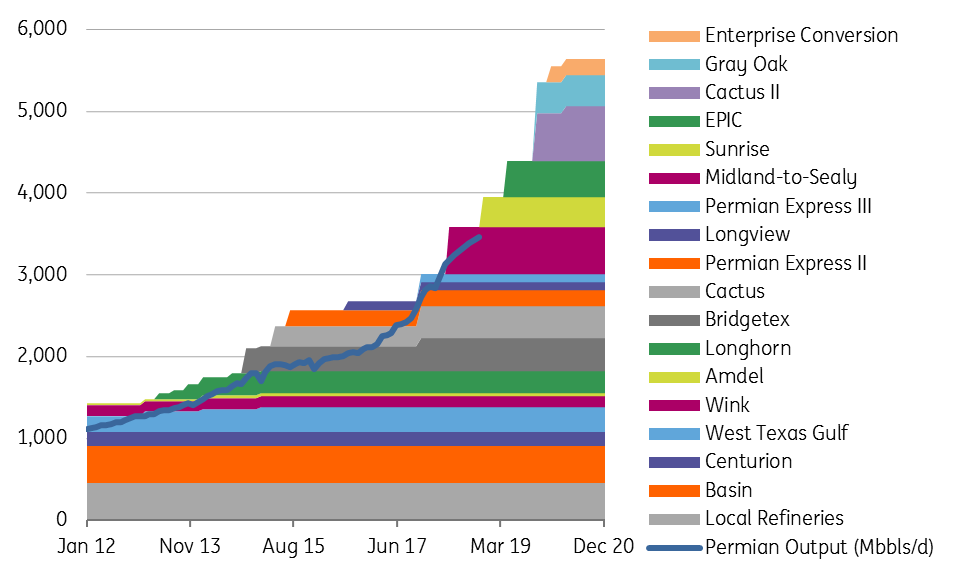
The key issue for the US industry continues to be takeaway capacity, specifically from the Permian region. Infrastructure has not been able to keep up with the pace of production growth, and this has been reflected in differentials- with Midland trading to almost an $18/bbl discount to WTI in early September. However more recently it has narrowed significantly to around a $7/bbl discount, driven by the expected startup of Plains All American’s 360Mbbls/d Sunrise pipeline by the 1 November. The industry will then have to wait until the 2H19 for further capacity, with an additional 1.4MMbbls/d of pipeline capacity expected to start up, until then though we would expect to see further pressure on the Midland/WTI spread.
Permian pipeline capacity constraints set to remain a theme through until 2H19 (Mbbls/d)

Tags
OilDownload
Download article
5 October 2018
In case you missed it: Finding the silver lining This bundle contains 9 articlesThis publication has been prepared by ING solely for information purposes irrespective of a particular user's means, financial situation or investment objectives. The information does not constitute investment recommendation, and nor is it investment, legal or tax advice or an offer or solicitation to purchase or sell any financial instrument. Read more
